There's no shortage of doom and gloom among Bitcoiners right now.
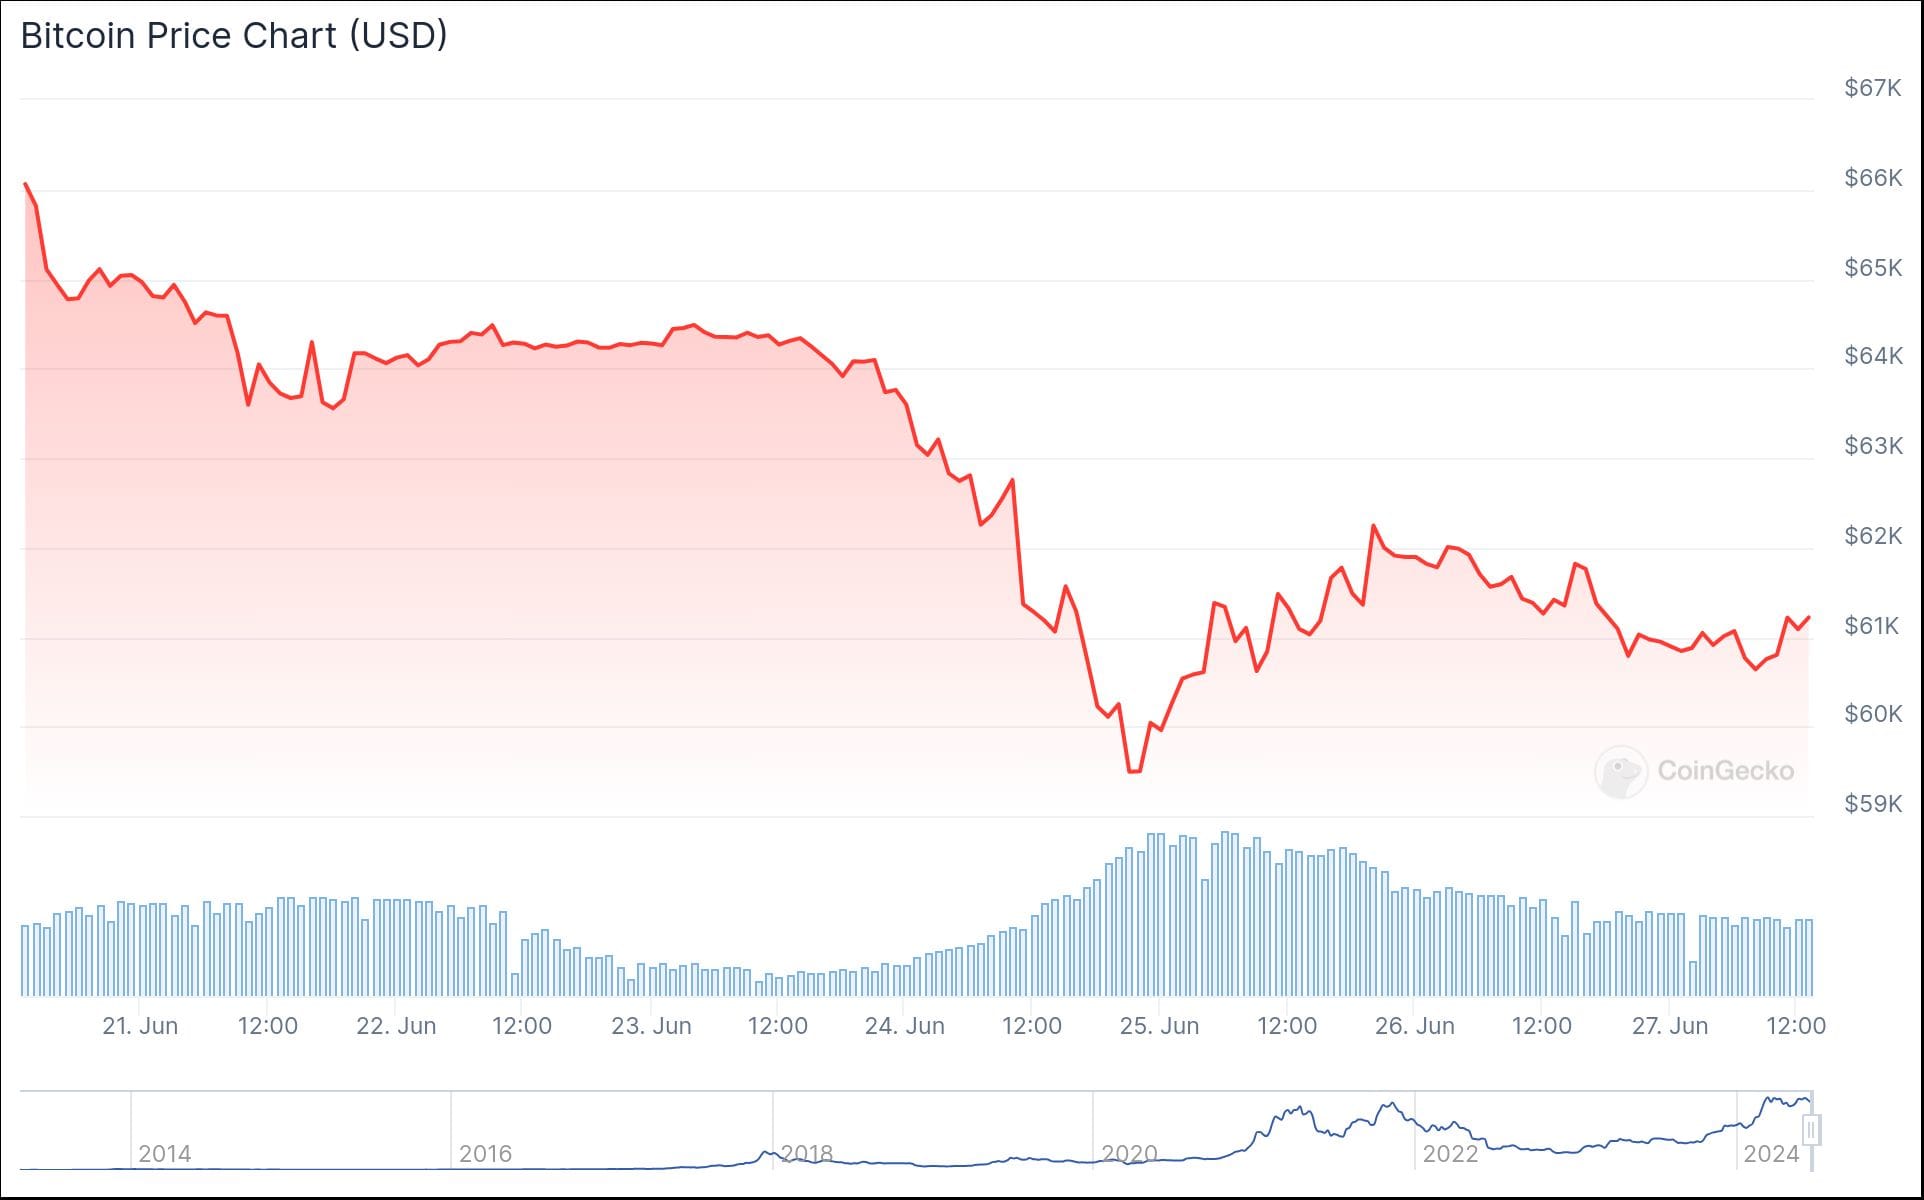
From murmurings that the German government are offloading seized BTC, to fears of immense selling pressure when Mt. Gox victims are finally compensated in July, the world's biggest cryptocurrency is clinging on to $60,000 for dear life.

Even the Crypto Fear & Greed Index has slumped sharply in recent days. It's now flashing a score of 40—indicating that investors are gripped by fear about what lies ahead for Bitcoin's price.
But as the old saying goes, it's important to zoom out and put the recent fluctuations into context. Bitcoin is now a $1.2 trillion asset class—a prospect that would have been unthinkable at the start of this year. What's more, prices have largely remained above $60,000 since February, an immense achievement.
And while there are some warning signs of greed still present in the market—with celebrities launching their own coins left, right and center—there's still a light at the end of the rainbow. Quite literally.

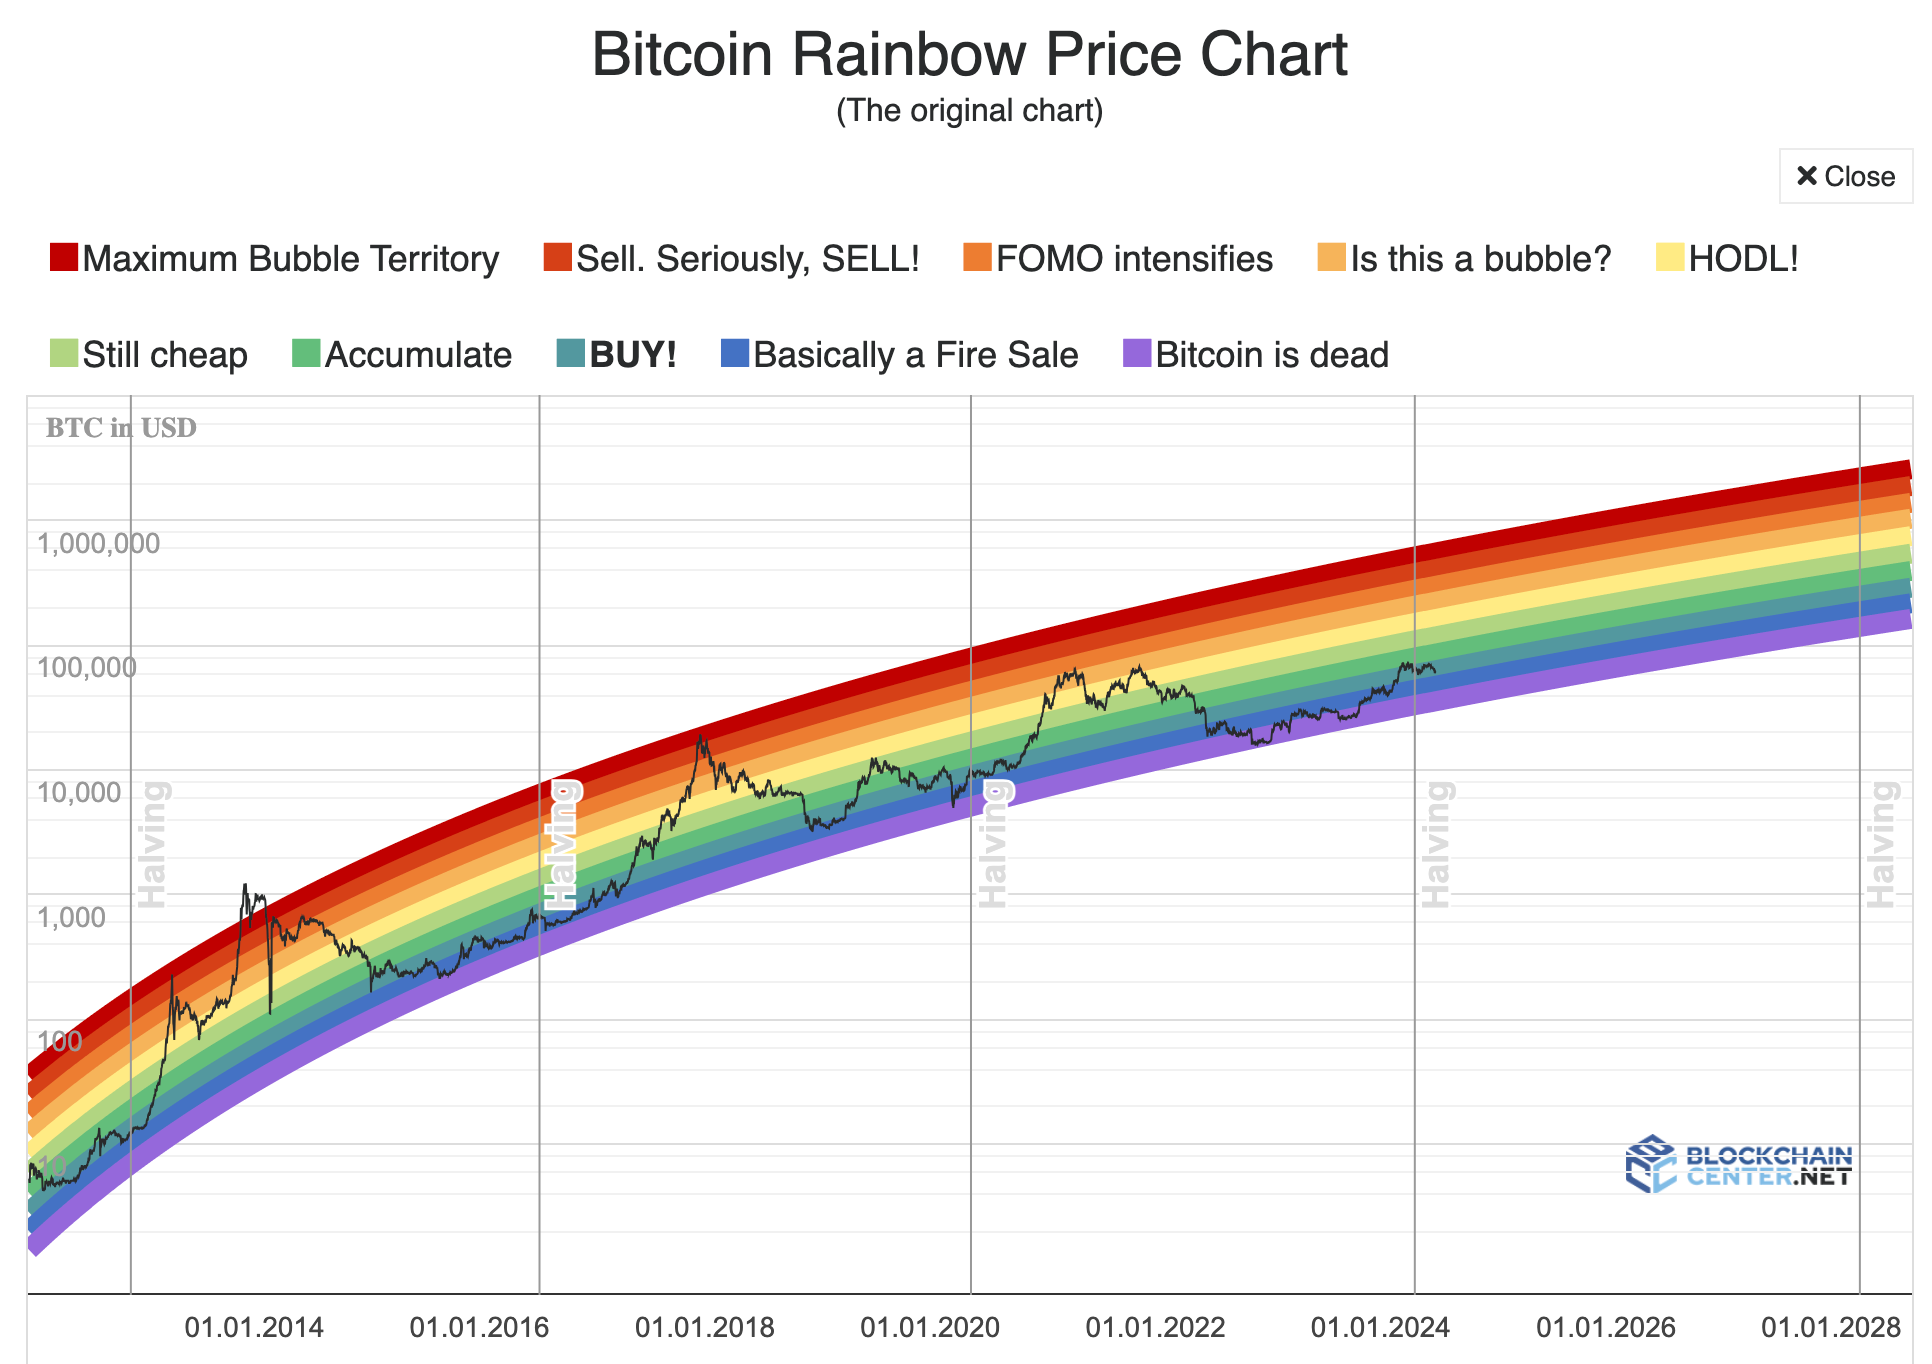
The Bitcoin Rainbow Price Chart remains a much-loved barometer of BTC's performance, with each color indicating whether this digital asset is underpriced or overvalued. Beyond being the center of many a meme, it's even served as a source of comfort for "diamond hand" investors resisting the urge to sell.
Rohmeo, its creator, says the chart "was NEVER a serious attempt to model or predict the price of Bitcoin." However, it ended up having a useful tool for poking fun at analysts who did attempt to launch "statistically sound" alternatives. One of them was PlanB, who was teased mercilessly after his bold prediction that BTC would hit $100,000 in 2020 didn't pan out.
1/15 Today, I'm comparing the two currently most popular bitcoin price models: Rainbow chart vs S2F!
— Eric Wall | BIP-420😺 (@ercwl) April 15, 2020
Rainbow chart:
✅ Tried & tested log regression (2014)
✅ Never changed
✅ Has emoji 🌈
S2F:
❌ New & complex (2019)
❌ Changes often
❌ Sounds like a sex position
A thread 👇 pic.twitter.com/1Td6pZXPM4
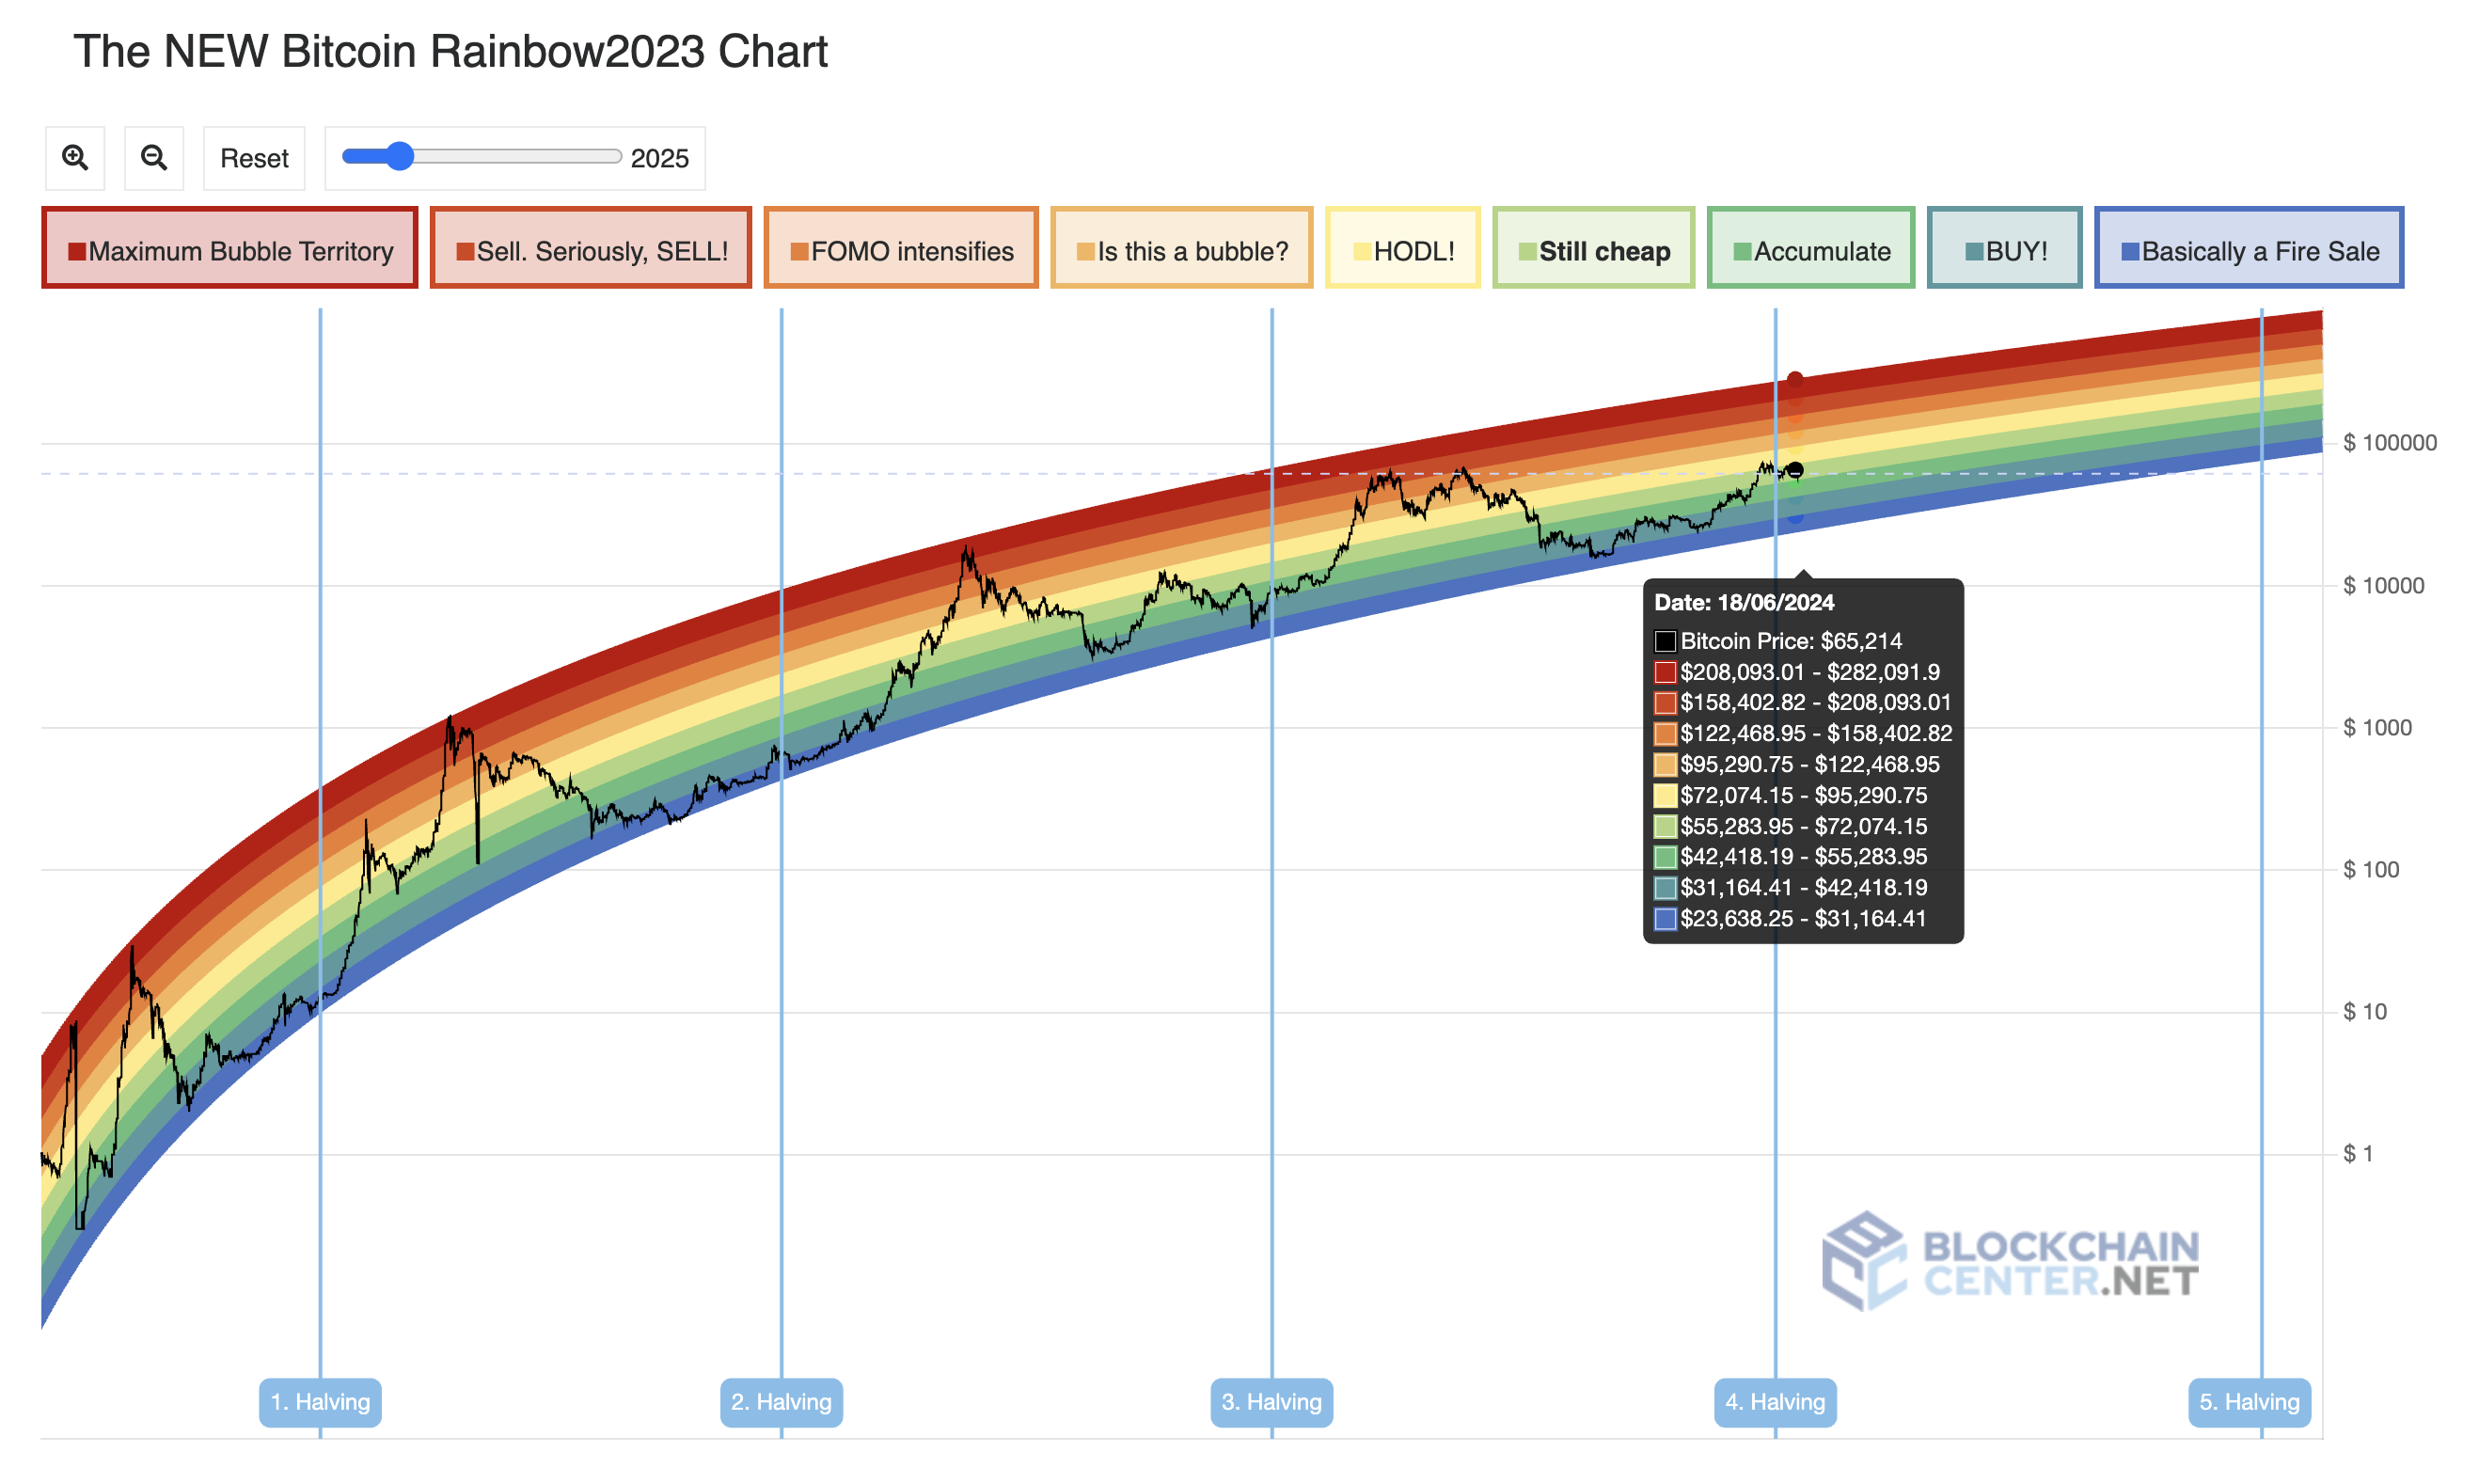
There have been some revisions to the Bitcoin Rainbow Price Chart, with a revamped version rolling out in 2023. It was amended to reflect when BTC had briefly fallen outside of the curve, with Rohmeo admitting that the old formula was "too optimistic."
So... what does V2 tell us about the current state of the market? Well, in a nutshell, Bitcoin is currently regarded as "still cheap."

Based on this metric, questions about whether a Bitcoin bubble is starting to form will only be asked when prices hit $95,000, with FOMO intensifying at $122,500. And if the chart is to be believed (bearing in mind it is tongue in cheek) the optimal time to sell is between the range of $158,400 to $208,000. Anything beyond that is "maximum bubble territory."
Even hitting March's all-time high of $73,750.07 seems fanciful at the moment. But hey, it's nice to dream.
